Chart of the Day: Kellogg Spinoff Bucks the Market Trend

The Chart of the Day belongs to the ready to eat cereal company WK Kellogg (KLG) . I found the stock by using Barchart's powerful screening functions to find stocks with the highest technical buy signals, highest Weighted Alpha, superior current momentum and having a Trend Seeker buy signal then used the Flipchart feature to review the charts for consistent price appreciation. Since the Trend Seeker signaled a buy on 1/ 11 the stock gained 61.63%.
WK Kellogg Co is an iconic North American food company with a differentiated portfolio of brands. In October 2023, Kellanova, formerly known as Kellogg Company, completed separation of its North American cereal business, WK Kellogg Co, resulting in two independent, public companies, each better positioned to unlock its full standalone potential. WK Kellogg distributed $663 million of cash to Kellanova as a dividend payment in connection with the Spin-Off. Additionally, in February of 2024 the board of directors declared a dividend of $0.16 per common share, payable on March 15, 2024 to share owners of record at the close of business on March 1, 2024. WK Kellogg's products are manufactured by the company in the US, Mexico, and Canada and marketed in the US, Canada and the Caribbean. Its iconic brand portfolio includes Kellogg's Frosted Flakes(R), Rice Krispies(R), Froot Loops(R), Kashi(R), Special K(R), Kellogg's Raisin Bran(R), and Bear Naked(R). Has 3150 employees. Chairman & C.E.O.: Gary Pilnick Address: One Kellogg Square Battle Creek, Mich.
Barchart's Opinion Trading systems are listed below. Please note that the Barchart Opinion indicators are updated live during the session every 20 minutes and can therefore change during the day as the market fluctuates. The indicator numbers shown below therefore may not match what you see live on the Barchart.com website when you read this report.
Barchart Technical Indicators:
- 100% technical buy signals
- 86.76+ Weighted Alpha
- Trend Seeker buy signal
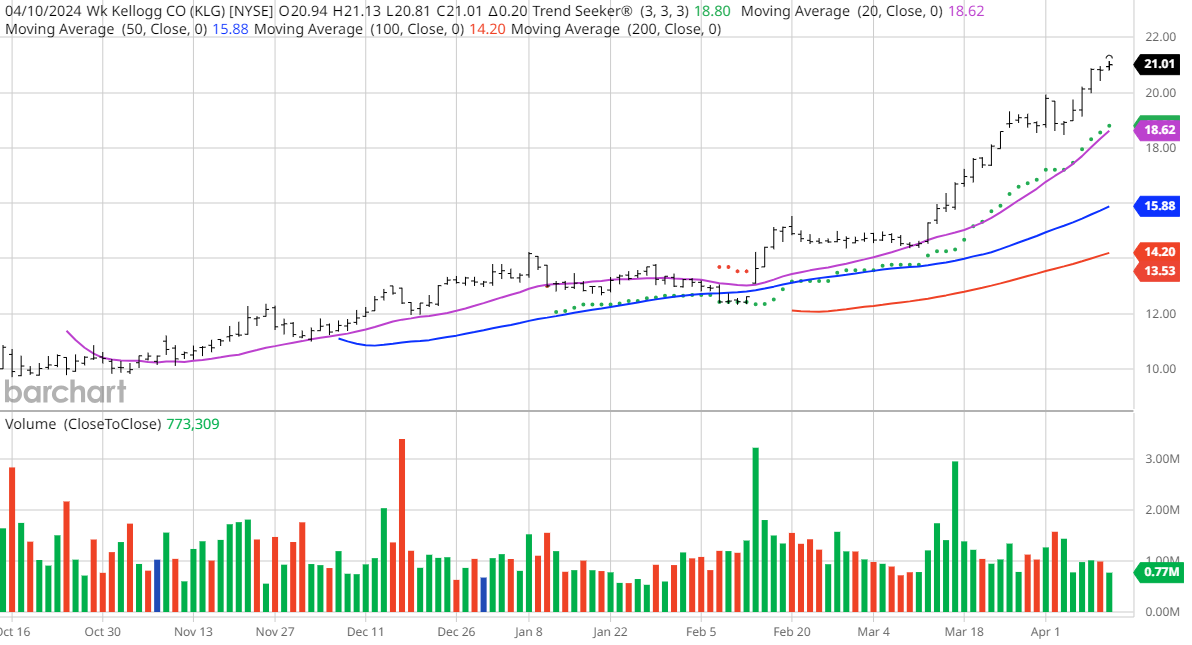
- Above its 20, 50 and 100 day moving averages
- 16 new highs and up 45.20% in the last month
- Relative Strength Index 80.05%
- Technical support level at $20.50
- Recently traded at $21.01 with 50 day moving average of $15.88
Fundamental Factors:
- Market Cap $1.79 billion
- Dividend yield 1.54%
- Earnings estimated to increase 15.60% this year and an additional 3.40% next year
Analysts and Investor Sentiment -- I don't buy stocks because everyone else is buying but I do realize that if major firms and investors are dumping a stock it's hard to make money swimming against the tide:
- Wall Street analysts have 2 strong buy, 8 hold and 1 under perform recommendation in place on the stock
- CFRA's MarketScope Advisor rates the stock a buy
- 1,670 investors monitor the stock on Seeking Alpha
Additional disclosure: The Barchart Chart of the Day highlights stocks that are experiencing exceptional current price appreciation. They are not intended to be buy recommendations as these stocks are extremely volatile and speculative. Should you decide to add one of these stocks to your investment portfolio it is highly suggested you follow a predetermined diversification and moving stop loss discipline that is consistent with your personal investment risk tolerance and reevaluate your stop losses at least on a weekly basis.
On the date of publication, Jim Van Meerten did not have (either directly or indirectly) positions in any of the securities mentioned in this article. All information and data in this article is solely for informational purposes. For more information please view the Barchart Disclosure Policy here.